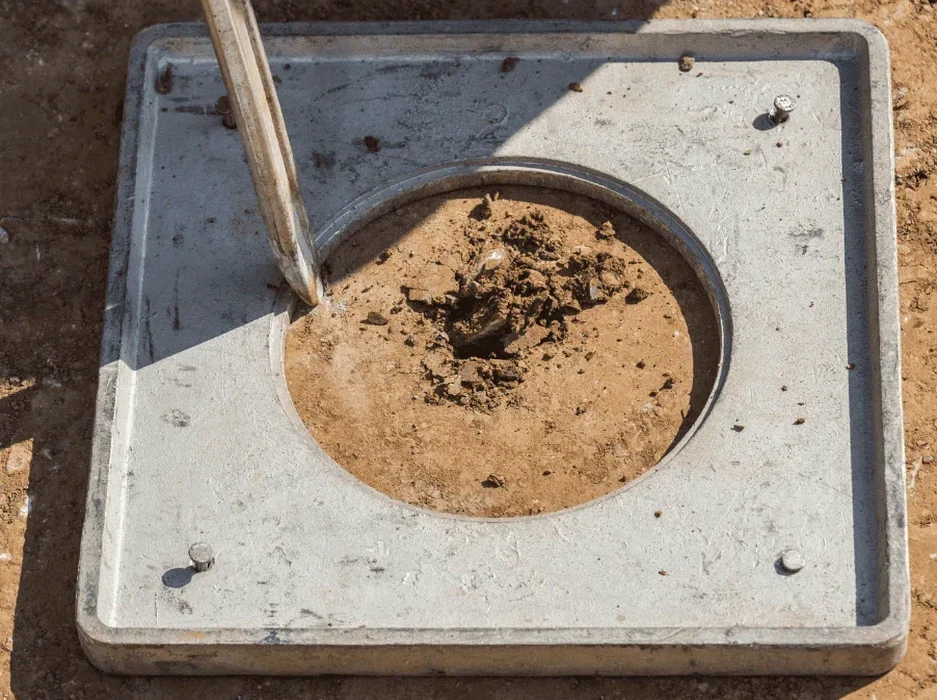
We recently reviewed the ground investigation for a new residential block along the Clyde waterfront, right where old dock infill meets natural alluvium. Glasgow's industrial past left a legacy of made ground that can behave unpredictably under seismic loading, even with the UK's moderate seismicity. A standard SPT log showed loose silty sand at 4 metres, and the groundwater was barely 1.5 metres below the surface. That combination — saturated granular soil, shallow water table, and a design ground acceleration from the British Geological Survey's hazard maps — meant a liquefaction screening was unavoidable. We ran the simplified procedure per BS EN 1998-5, checking factor of safety against the cyclic stress ratio for the critical layer. The site-specific CPT testing gave us continuous tip resistance and pore pressure data that refined the fines content estimate, something the earlier borehole logs couldn't resolve with confidence. On Glasgow's post-glacial deposits, skipping the analysis isn't a shortcut — it's a structural gamble.
A saturated loose sand at 1.5 metres depth in Glasgow's alluvial corridor can liquefy under a magnitude 5 event — the hazard is real, not theoretical.
Process and scope
The ground beneath Glasgow tells two very different stories. North of the river, around the city centre and Merchant City, you encounter dense glacial till — stiff, overconsolidated, and generally not prone to liquefaction. Cross south into the Clyde floodplain, through Govan or parts of the International Financial Services District, and the profile flips: layers of loose alluvial sands, silts, and anthropogenic fill up to 10 metres thick. We've seen borehole data from Tradeston where the SPT N-values dropped below 8 in saturated zones, triggering a mandatory liquefaction assessment under BS 5930. In those southern districts, the post-industrial ground combined with a water table often less than two metres deep creates exactly the conditions Seed & Idriss described in their classic work on liquefaction susceptibility. Where the analysis flags marginal safety, ground improvement becomes part of the conversation — we often pair the seismic assessment with a stone columns design to densify the critical layers and provide drainage, reducing excess pore pressure during a seismic event. The contrast between the stable till and the vulnerable alluvium across a single postcode defines half our preliminary desktop studies.
Site-specific factors
Glasgow sits in a low-to-moderate seismicity region, but the risk profile changes entirely when you factor in the city's 200-year industrial legacy. The old mill lades, infilled docks, and layers of colliery spoil across the East End create heterogenous fills where pore pressure can spike locally during even a modest tremor. We've mapped areas in Dalmarnock and Bridgeton where the made ground thickness exceeds 8 metres and the post-seismic settlement predicted by the Tokimatsu and Seed method exceeds 50 millimetres — enough to shear utility connections and crack rigid pavements. Rainfall in the west of Scotland averages over 1,100 millimetres annually, keeping the shallow aquifer perpetually high; that persistent saturation means the liquefaction window stays open year-round, not just seasonally. For critical infrastructure like the Shieldhall Tunnel or new bridge piers on the M8 extension, we combine the liquefaction analysis with seismic microzonation studies to map lateral spreading hazard along riverbanks, where the ground can displace laterally by several centimetres under cyclic loading.
Relevant standards
BS 5930:2015+A1:2020 — Code of practice for ground investigations, BS EN 1998-5:2004 (Eurocode 8) — Silos, tanks and pipelines, BS EN 1998-1:2004+A1:2013 — General rules, seismic actions and rules for buildings, BS EN ISO 22476-1:2012 — Field testing (CPT and SPT procedures), CIRIA C750 — Groundwater control
Questions and answers
Does Glasgow really need liquefaction analysis given the low UK seismicity?
Yes, particularly on the alluvial and made ground south of the Clyde. The combination of loose saturated sands, a shallow water table, and the presence of sensitive infrastructure can produce damaging settlements even under a magnitude 5 event. BS EN 1998-1 requires the assessment when the design acceleration exceeds 0.02g and the ground profile includes saturated granular soils — a scenario we encounter frequently in the city's redevelopment zones.
What site investigation data do you need for the liquefaction analysis?
The minimum dataset is SPT N-values with energy correction (N1,60) and grain size distribution from disturbed samples to determine fines content. We prefer to supplement this with CPTu soundings — the continuous profile of tip resistance and pore pressure gives us a far sharper picture of thin liquefiable lenses that SPTs at 1.5-metre intervals can miss. Shear wave velocity profiles from MASW or downhole testing also support the assessment.
How much does a liquefaction analysis cost for a project in Glasgow?
A full liquefaction triggering analysis for a typical site, including data processing, CRR/CSR calculation, and settlement estimation, ranges from £2,110 to £3,460 depending on the number of boreholes and CPT soundings. Sites with complex stratigraphy or requiring LPI mapping across a large footprint fall at the upper end of that range.
What is the difference between the simplified procedure and advanced numerical modelling?
The simplified procedure, as codified in EN 1998-5, compares CSR and CRR for each layer and is suitable for most building and infrastructure projects. Advanced modelling — using effective-stress constitutive models like PM4Sand in finite element codes — captures excess pore pressure generation and redistribution over time, which becomes important for deep excavations near the river or when assessing lateral spreading displacement along quay walls.
Can you assess residual settlement after liquefaction?
Yes, we estimate post-liquefaction volumetric strain using the Tokimatsu and Seed or Ishihara and Yoshimine correlations, which relate the factor of safety against liquefaction to expected strain. We integrate those strains over the liquefied depth to produce a surface settlement profile, which the structural engineer uses to check differential movement tolerances for the foundation system.